
Business Operations System · Level 2 example
Sales Pipeline Reporting
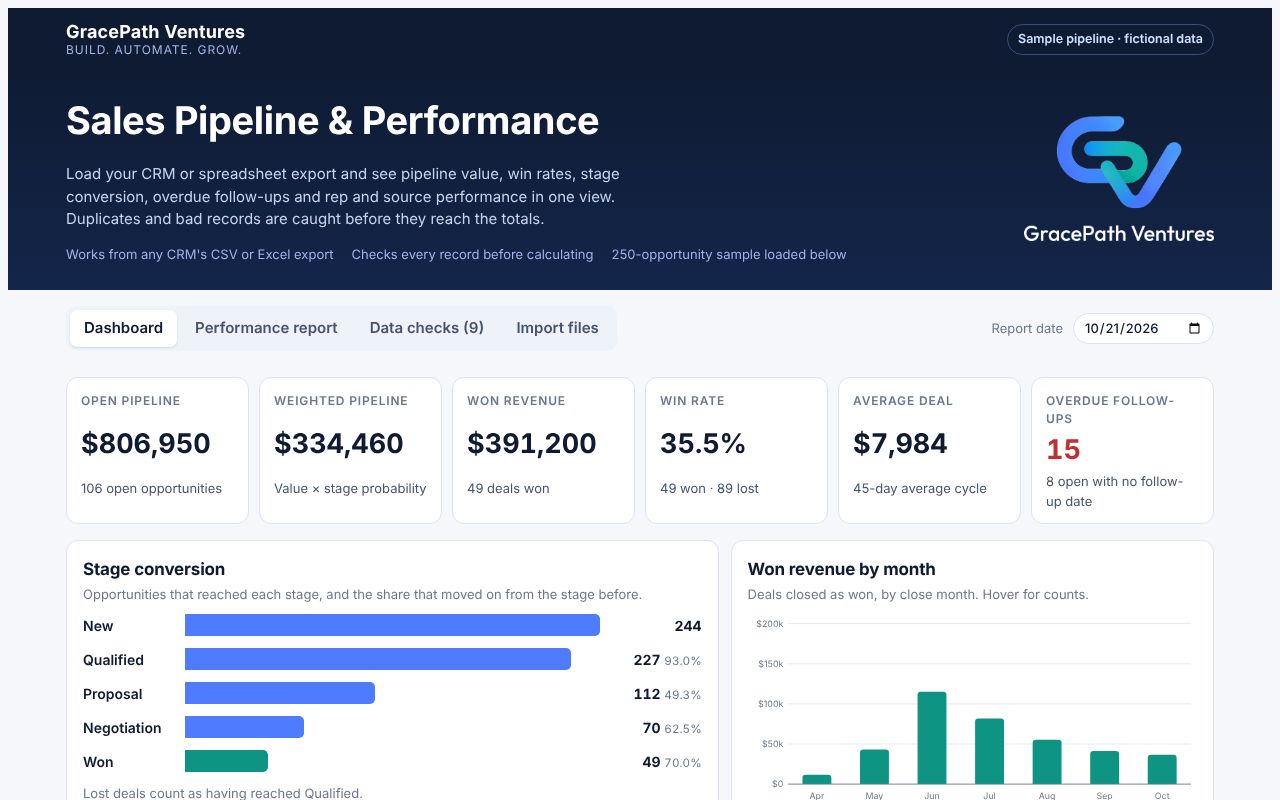
See your pipeline value, win rate and every overdue follow-up from the CRM or spreadsheet export you already have, with duplicates and data errors flagged before they skew your numbers.
What you get
- Open pipeline and weighted forecast by stage
- Win rate, average deal size and sales cycle
- Overdue and missing follow-ups, so no deal goes cold
- Results by salesperson and lead source
- Possible duplicates and data errors held back from totals
- Excel or Google Sheets first; live dashboards as you grow
Quoted per project
Walkthrough
Two-minute tour
Fictional sample data: 250 opportunities with seeded data problems.
Ready to start?
Tell us where you want to start. We recommend a level and send a fixed quote before any work begins.